Open Thread
The long holiday weekend means that we are heading out to visit relatives in western Colorado.
Seems like the perfect excuse to have an open thread. See you guys next week.
GNOCDC Repopulation Map - Now with Google Street View
We’ve just rolled out the latest update to the Greater New Orleans Community Data Center (GNOCDC) Repopulation Google Maps application. Thanks to Matt Priour figuring out how to add the Street View imagery to our New Orleans Repopulation Map, you can now not only see where people are coming back to The Crescent City, but the rebuilding efforts from the street level.
Repopulation Indicators for New Orleans
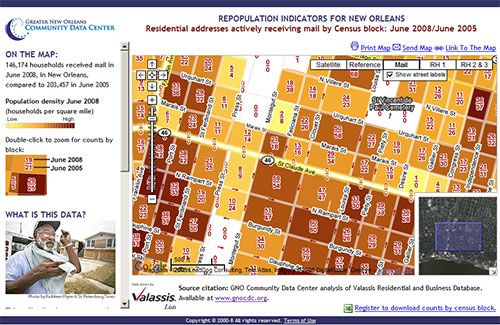
The map is powerful because you can look at the address counts by block between June 2005 and June 2008 and see how many people are returning to New Orleans. Of course you can pan over to the Lower Ninth Ward and see neighborhoods that are struggling to recover, but overall much of the city has recovered substantially. What is unique about this map is the source of the data. Getting accurate counts of the population of New Orleans has been difficult, but as this Wired article mentions, “Junk Mail to the Rescue”. Now the Google Street View imagery has been very good at helping see the reasons why changes have occurred after Katrina. The aerial imagery of New Orleans was taken on March 2006, near the low point of the recovery. If all you ever use to see the recovery of New Orleans is the Google Maps or Google Earth satellite imagery, you are many of the changes that have occurred more than two years since those images were taken. Even the Google Street View imagery is a year old which can distort realities on the ground. The USPS repopulation data is updated monthly so it is actually the most relevant data in this mashup application.
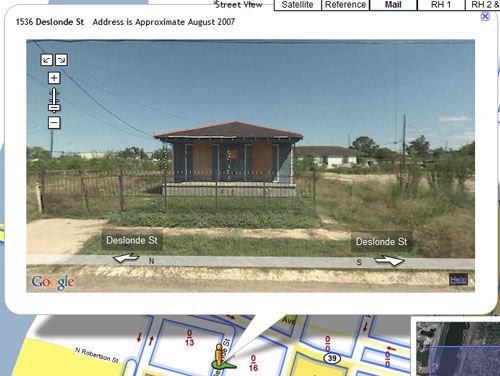
While some areas are still struggling to recover…
…rebuilding in New Orleans continues
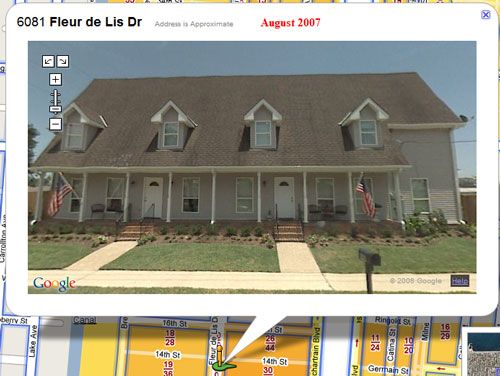 Rebuilding in New Orleans Continues
What the Valassis data is great at documenting the recovery at a macro level, and the Google Street View data helps you analyze the results on a macro level. Being able to visualize the recovery this way gives you a great appreciation for how much work has been accomplished and how much more there has to be done. Unfortunately there was no “Marshal Plan” for the recovery, but progress has been made and hopefully tools such as this Repopulation Map will help further the rebuilding of New Orleans.
I’ve been lucky enough to work with Denice Warren Ross, deputy co-director of the nonprofit Greater New Orleans Community Data Center and Joy Bonaguro on this project. Their vision of how they wanted this data presented to the community was to make it as simple as possible to use. The ability to take data created in ESRI ArcGIS Desktop and serve it from Amazon’s S3 and integrate it with Google’s simple visualization tools (Google Maps and Google Street View) created a map that tells quite a story and is so much more useful than the PDF maps that existed before Katrina.
Also, one thing to keep in mind is August 29th is the 3 year anniversary of Katrina’s landfall in New Orleans. The GNOCDC’s Katrina Index is a great way to see the progress of the recovery of New Orleans, three years later.
Hurricane Gustov continues to head toward the Gulf Coast so everyone please be careful in its path.
GNOCDC Repopulation Map - Now with Google Street View
We’ve just rolled out the latest update to the Greater New Orleans Community Data Center (GNOCDC) Repopulation Google Maps application. Thanks to Matt Priour figuring out how to add the Street View imagery to our New Orleans Repopulation Map, you can now not only see where people are coming back to The Crescent City, but the rebuilding efforts from the street level.
Repopulation Indicators for New Orleans

The map is powerful because you can look at the address counts by block between June 2005 and June 2008 and see how many people are returning to New Orleans. Of course you can pan over to the Lower Ninth Ward and see neighborhoods that are struggling to recover, but overall much of the city has recovered substantially. What is unique about this map is the source of the data. Getting accurate counts of the population of New Orleans has been difficult, but as this Wired article mentions, “Junk Mail to the Rescue”. Now the Google Street View imagery has been very good at helping see the reasons why changes have occurred after Katrina. The aerial imagery of New Orleans was taken on March 2006, near the low point of the recovery. If all you ever use to see the recovery of New Orleans is the Google Maps or Google Earth satellite imagery, you are many of the changes that have occurred more than two years since those images were taken. Even the Google Street View imagery is a year old which can distort realities on the ground. The USPS repopulation data is updated monthly so it is actually the most relevant data in this mashup application.
While some areas are still struggling to recover…

…rebuilding in New Orleans continues
 Rebuilding in New Orleans Continues
What the Valassis data is great at documenting the recovery at a macro level, and the Google Street View data helps you analyze the results on a macro level. Being able to visualize the recovery this way gives you a great appreciation for how much work has been accomplished and how much more there has to be done. Unfortunately there was no “Marshal Plan” for the recovery, but progress has been made and hopefully tools such as this Repopulation Map will help further the rebuilding of New Orleans.
I’ve been lucky enough to work with Denice Warren Ross, deputy co-director of the nonprofit Greater New Orleans Community Data Center and Joy Bonaguro on this project. Their vision of how they wanted this data presented to the community was to make it as simple as possible to use. The ability to take data created in ESRI ArcGIS Desktop and serve it from Amazon’s S3 and integrate it with Google’s simple visualization tools (Google Maps and Google Street View) created a map that tells quite a story and is so much more useful than the PDF maps that existed before Katrina.
Also, one thing to keep in mind is August 29th is the 3 year anniversary of Katrina’s landfall in New Orleans. The GNOCDC’s Katrina Index is a great way to see the progress of the recovery of New Orleans, three years later.
Hurricane Gustov continues to head toward the Gulf Coast so everyone please be careful in its path.
License Microsoft Virtual Earth Imagery For Your Maps
ESRI and Microsoft announced that Virtual Earth would be available through the ArcGIS Online Premium Service a couple weeks ago and today Microsoft took that announcement one step further.
Starting today you can license Virtual Earth UltraCam (proprietary) aerial photography without having to license the Virtual Earth platform. This is great for offline use, wrapping your own client or creating an interface that allows for deeper zooming than the VE platform does today. You can purchase the photography through 2 vendors - Mapmart and i-Cubed.
Of course ESRI users will probably prefer to use the ArcGIS Online service (given how easy it will be to integrate into your existing projects), but now everyone has the same access and the freedom to use any software (Photoshop, Illustrator, gvSIG, MapInfo, AutoCAD, etc) they wish.
The only caveat is that this is the UltraCam imagery, not everything so you may not have anything available if you live outside of 200+ cities that have coverage. Of course if you do have it available, then there isn’t anything better as UltraCam blows away everything else. Microsoft’s purchase of Vexcel has really been very smart for them and this is what you can do when you own the data. I can buy UltraCam imagery for Tempe, AZ for about $4,000 from MapMart.
You can’t afford one yourself, but you can use the data captured from it.
 You cant afford one yourself, but you can use the data captured from it.
ESRI ArcGIS Explorer Build 500 Released
Catching up a little from last week, I missed the news that AGX Build 500 was released. This release isn’t the Build 600 that some have been looking for, but does add the ability to work with the new updated ArcGIS Online, including the premium services (Microsoft Virtual Earth). The update is available from ESRI’s servers.