Why d3 Will Change How We Publish Maps
Publishing maps to the web. Simple right? Just reproject all your data to web mercator and be done with it. Have we all learned to live with the crazy distortion? Do we need mercator to help us get our galleons from the Spanish Main back to the king? Of course not, but we’ve all learned the world is not flat since then.
 Bill Gates
Five years ago I complained about polar projections because of a project I was working on. I even offered up a SVG example from Esri’s ArcWeb project (that’s how desperate I was!). What I ended up doing is using web mercator and then “transitioning” to Bipolar Oblique Conic Conformal as needed. It was ugly but the client was happy.
Well I’ve never really abandoned this quest. SVG has always seemed to hold a promise for client side projections of data, but support has been weak. This fall a new project has really gotten my attention, D3.
D3.js is a JavaScript library for manipulating documents based on data. D3 helps you bring data to life using HTML, SVG and CSS. D3’s emphasis on web standards gives you the full capabilities of modern browsers without tying yourself to a proprietary framework, combining powerful visualization components and a data-driven approach to DOM manipulation.
Bingo, D3 takes the browser out of the equation so you can just focus on the visualization. The really cool thing about D3 is that it gives you geographic projections. You can even add your own custom projections. Finally a library that gives you the ability to publish the data the way you want, rather than shoehorning it into some crazy projection named after a guy who probably thought there were sea monsters.
The examples are great and this sick D3 satellite view from @vtcraghead
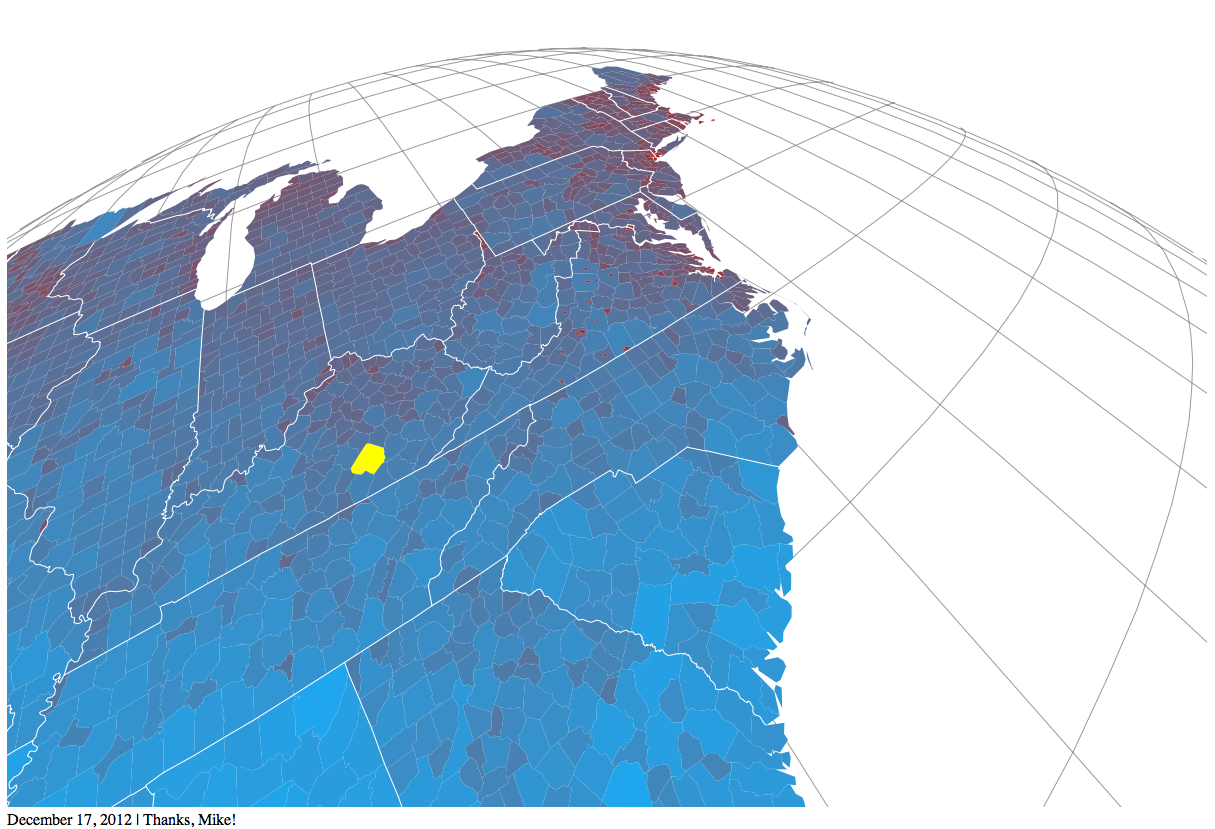 D3 Sat